In a previous post I looked at how to create an age/gender classifier using Keras. In this post we'll look at the final product - a web app that uses the classifier to generate a life insurance quote. To get from the python model to the finished product involves a few steps:
- The model is loaded into an R session with the R Keras package
- A new image is imported and used to generate predictions for age and gender
- The age and gender values are used in conjunction with standard actuarial tables to generate a premium
I use a 'shiny' app to provide the user with an interface to actually produce the quote. In the background, it's basically just running through the steps described above. We've given the user the ability to vary the level of cover and term they want - the premium will update automatically. This is something that R 'shiny' is great for.
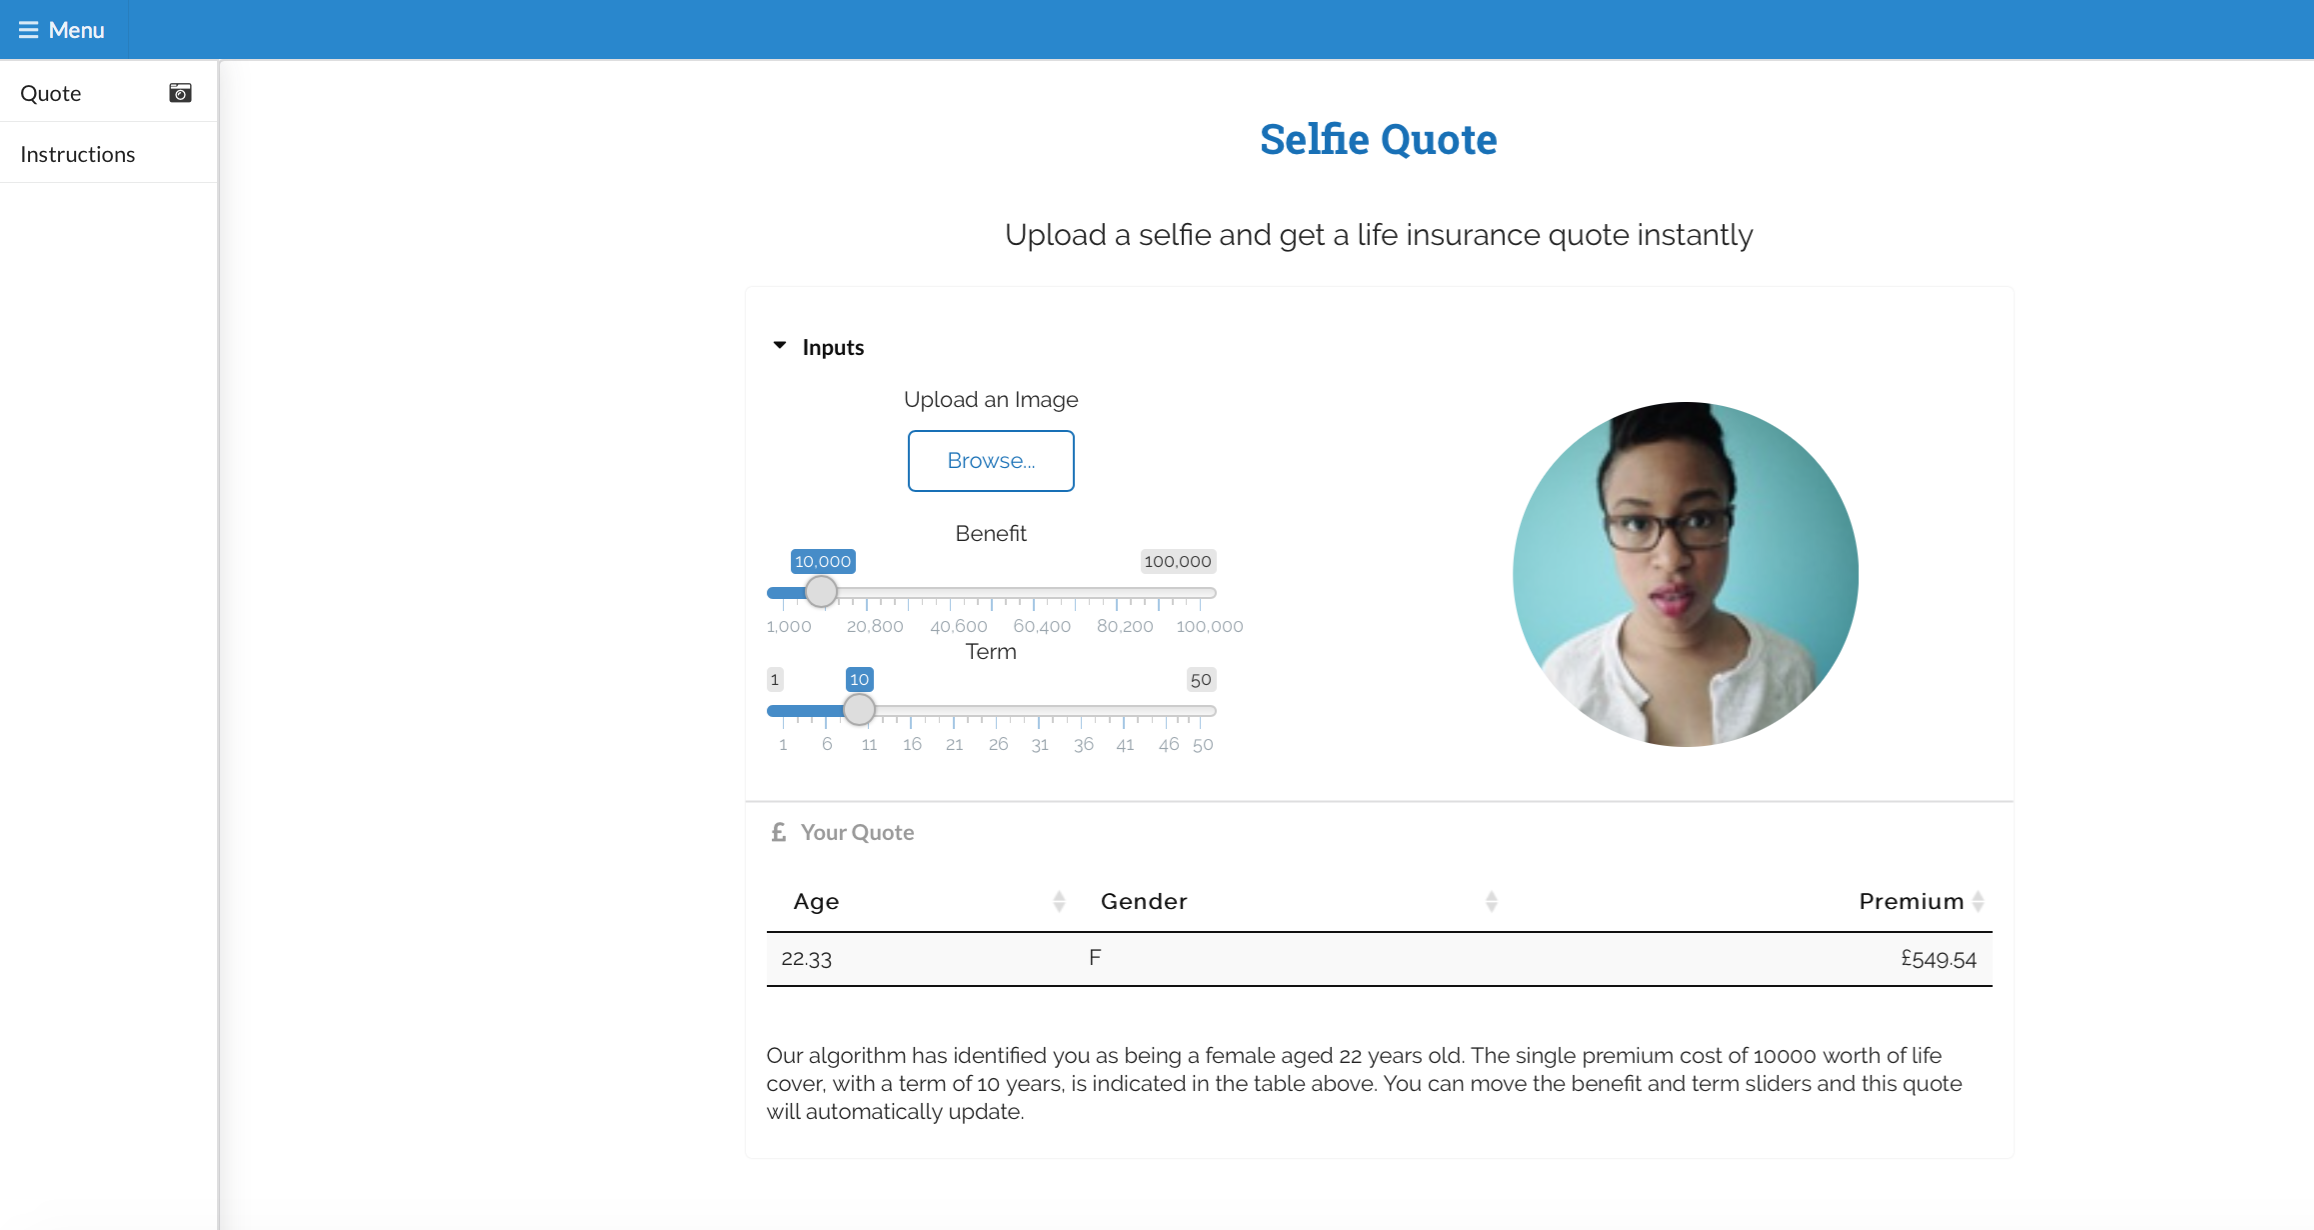
First things first, here is the final app - it's been styled using the semantic.shiny package and custom CSS.
To calculate the single premium I have used actuarial commutation functions. If you're not familiar with these, don't worry too much. The actual pricing basis I use isn't really important and is really just for demonstration purposes.
Loading a Keras Model into R
To load the model into R, use the R Keras package. To install this, use install.packages('keras'). If for some reason you don't already have the Keras python package installed you can use the install_keras() function to install it.
To load the model simply execute load_model_hdf5('wide_res_py.h5') in your R console or in the shiny script.
Loading an Image
The loading of images is taken care of by the shiny app. I use a file input (styled in CSS) in the ui function.
fileInput('photo', label = 'Upload an Image', accept = c('.jpg', '.jpeg', '.png'))
The server function can then access this image and pass it to the Keras model which predicts age and gender.
Keras R Functions
This is done in the shiny server function, once an image has been loaded by the user. To generate predictions, convert the image to a 4D tensor with a single element in the batch dimension, then use the predict function. For example:
img <- image_load(img_path, target_size = c(64,64))
x <- image_to_array(img)

# ensure we have a 4d tensor with single element in the batch dimension,
x <- array_reshape(x, c(1, dim(x)))

# make predictions then decode and print them
preds <- model %>% predict(x)
Premium Calculations
I have made use of the 'life contingencies' R package to perform the pricing calculations - this is a really useful package for performing actuarial calculations quickly and efficiently. It can calculate actuarial values for n-year term assurances, endowments, whole life assurance policies and so on. All you will need to work with this package is a life table. A life table represents survivorship of a population - for each age in the table, starting at 0, we track how many people are still alive at the next age, all the way up to some limiting age (say, 100). We can then calculate annual mortality probabilities for each age and use these for valuing different life products (or rather, the life contingencies package can do this for us!). I have used 'English Life Tables No. 17'.
The app reads in the ELT Excel tables (using the readxl package), converts these to actuarial tables that the life contingencies package can work with and then uses the built-in functions provided with the package to calculate premiums (allowing for profit and expenses!). If you're interested, the code for this part is below.
# pull in elt17 and check calcs

eltMale = as.data.frame(read_excel(path = paste(getwd(), '/AM92/elt17.xls',sep=""),
                                   sheet = 'ELT17', range = 'D9:D121', col_names = FALSE))

eltFemale = as.data.frame(read_excel(path = paste(getwd(), '/AM92/elt17.xls',sep=""),
                                     sheet = 'ELT17', range = 'N9:N121', col_names = FALSE))


# convert to actuarial life tables - all we need is a vector of ages (starting at 0)
# and corresponding alive population at each age
eltMaleAct = new("actuarialtable",x=seq(0,112,by=1), lx=eltMale$X__1,
                 interest=0.04, name="example actuarialtable")

eltFemaleAct = new("actuarialtable",x=seq(0,112,by=1), lx=eltFemale$X__1,
                 interest=0.04, name="example actuarialtable")

# Now, in the shiny server function we do the following:

# set fixed expense & profit assumption
    fixed_expense = 500
    profit = 0.05

    # calc will be different depending on whether male/female - use ifelse statement
    # (note, age() & gender() are PREDICTED using keras)
    if(gender() == 'M'){
      comm_function = Axn(actuarialtable = eltMaleAct,
                          x = age(), n = input$term)
    } else {
      comm_function = Axn(actuarialtable = eltFemaleAct,
                          x = age(), n = input$term)
    }

    # return premium
    (input$amt * comm_function  + fixed_expense)*(1+profit)
Using the App
A user can simply hit the 'upload an image' button and choose a .png or .jpg file on their local machine. This will automatically be passed through the Keras model and the age and gender predictions will be stored. A datatable showing the predicted age, gender and single premium will be returned in the 'Your Quote' section of the app.
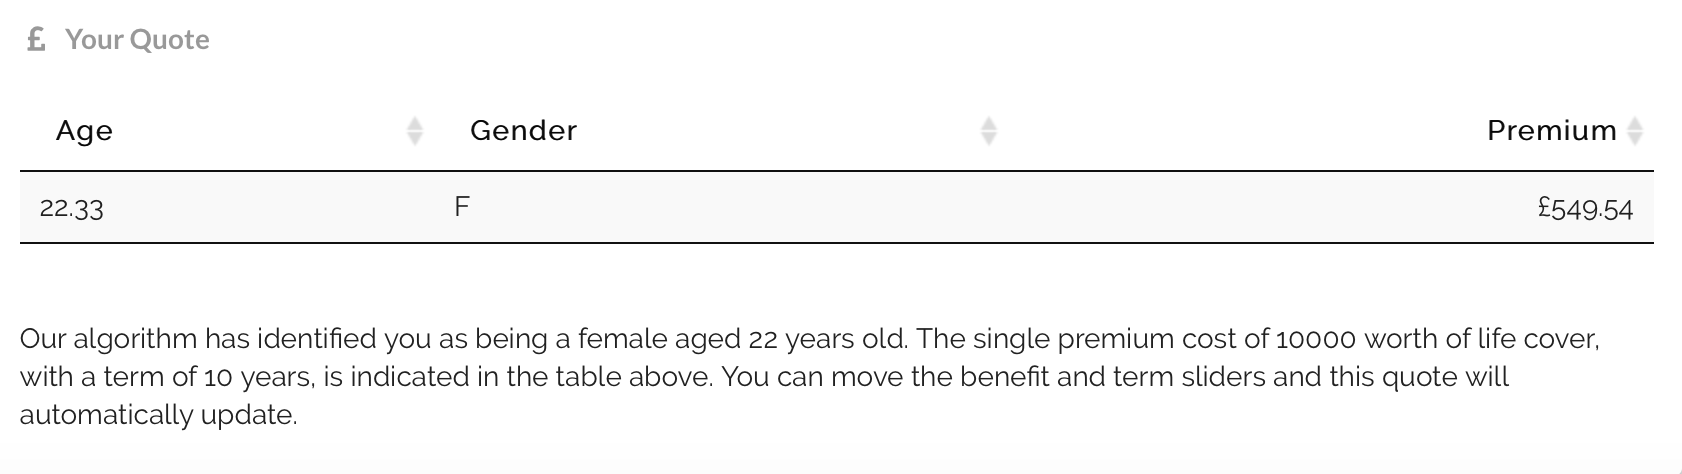
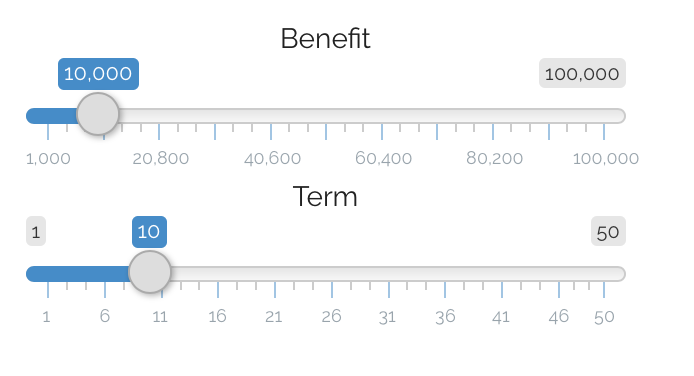
The user can alter their cover level and preferred term using the shiny slider inputs and the datatable will automatically update.
Conclusion
I haven't covered all the code in great detail here - the reason being, some of it is reasonably complex! But hopefully this gives you an idea of what you can achieve and may help you generate ideas when considering how to deploy some of your own deep learning models. If you'd like to see the full R shiny code then feel free to leave a comment or get in touch and I will share this with you.
Comments
comments powered by Disqus